

Topic027: Quasar Decay – The Hubble Deep Field, Bill Tifft, 10/01/16
Book figures Seminar 5, Figures 6 and 10
Book figures Seminar 5, Figures 19 and 18
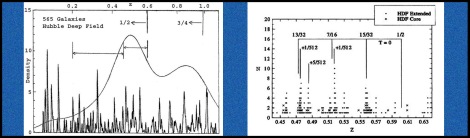
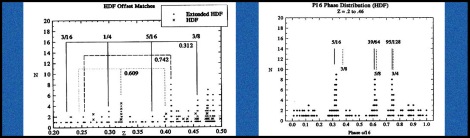
The upper left frame of the lead figure (book figure 5.6) is galaxy density distribution using (Cohen et al.) Hubble Deep Field studies, (see references listed elsewhere on the blog site). (For book information or acquisition see Post001 and Post002.) A solid line shows the galaxy overdensity distribution. Vertical lines mark observed locations of the c/2 and 3c/4 quasar peaks and (connected by arrows) redshift segments studied. The upper right frame (book figure 5.10) shows the redshift pattern of the HDF galaxy redshifts (z = 0.44 to 0.64) and their correspondence to specific Lehto-Tifft fractions of c. The lower right leading diagram (book figure 5.18) is the P = c/16 phase distribution of the foreground HDF redshifts (z = 0.20 to 0.46) after the transformation to the cosmic rest frame and cosmic correction for curvature of time (from Topics 11 and 10). The c fractional periods are the three actual redshift peaks at z = .321, .410 and .457, shown in the lower left leading diagram (book figure 5.19), now enhanced by galaxies precisely in phase (belonging to the same period) at other redshifts. The diagrams make it quite clear that to study or even detect periods the transformation and correction MUST be applied. Furthermore, since each sample used can involve different T states and be populated by galaxies at different stages of temporal evolution, individual deep sky samples from small areas MUST be studied separately, exactly as individual star clusters are examined. Compare the second field studied by Cohen et al, in the terminal figure of this blog (book figure 5.15), with the HDF field. This second field shows still further decay to nc/64 and nc/32 levels related to c/2 and 3c/8 levels plus a T = 6 form associated with 5c/8. Massive redshift collections over all sky, large areas, or with widely different properties (such as the degree of activity) should not be combined in quantization studies.
The upper left leading figure shows enhanced galaxy density directly below the key high redshift values of c/2 and 3c/4. This is clear evidence implying that galaxies are the product of quasar decay. The upper right figure shows there are no objects at z(LT) = 1/2, but galaxies do appear as periodic sequences at or near nc/32 and nc/16 values directly below 1/2. As noted previously quantization proceeds in two forms, period doubling (factors of two), which define the basic T (energy) states, and cyclical decay cycling within its own energy state once its energy state forms (leading key energy states are usually marked by activity). The HDF diagram shows no sign of the key ½ state which, in the QTC model, has decayed to the c/32 level, 4 doubling levels later in its evolution. Normal doubling patterns would proceed through 1/4, 1/8 then 1/16 states first. To see that it has in fact done that, the lower left leading foreground HDF phase diagram shows the 1/4 state (phase 0.25) is also absent as is 3/8 (phase 0.375) and is nearly gone at 1/8 (phase 0.125). As confirmation refer to the lower left lead figure in Topic026 where the `active’ galaxy 1/8 peak is present but weak compared with the current dominant c/16 and c/32 peaks. Decay of the now non-existent 1/2 quasar state has evolved to locally common 1/16 and higher doubling states. Further, nothing has replaced those missing states. The foreground phase diagram also shows similar displacements below 3/4 and its 5/8 decay states which are also absent or faded. It appears that the effective lifetime of a primary doubling state is no more than about 4 or 5 overlapping cyclical stages. Our galaxy is in D level 12 (Nuclear dipole = 73 km/s). Extreme dwarf observed variable redshift stages are at doubling level 16 or17, 4 or 5 higher than us, with about 2 km/s periods that show cyclical shifts every few years. This overall decay picture has major implications for the future history of our galaxy. Since earlier segments of timelines cross our lookback line at a 45 degree angle (discussed in the next blog) the range of doubling overlap may relate to the temporal width of our `now’ zone. We can see earlier stages of `now’ (the past) only by redshift lookback in time.
As developed above, and observationally demonstrated via the HDF sample, the universe is decaying through a wave function doubling process which breaks up its primary doubling pattern into a succession of fractional cyclical stages. Fractional stages then in turn decay in still higher fractional cyclical stages. The HDF 7/16 and 15/32 stages are shown to be decaying, (upper right lead figure), progressively in n/512 steps – seen 4 levels higher in overlapping doubling fractions. The 512 states are shown as offsets which appear in a less advanced progressive pattern as the deviation from 1/2 increases. The multi-sequence pattern 1/4 + 1/8 + 1/16 + 1/32 + … –> 1/2, conserves energy, or more accurately releases decay energy in progressive smaller steps which merge smoothly into chaos as the universe ages. How is the energy actually released? In QTC each level is actually one possible time anti-time split so levels represent the energy of a nuclear dipole split decaying toward zero. The decay energy involved is, first, through the conversion into matter at compressed wave function nodes where nuclear dipole matter generated can expand and classically decay, and secondly, by the curvature correction (continuous redshifting of photons as they follow the 3-d curvature of time once leaving space). These continuous forms of decay provide a (or the) source of entropy as seen from space. However, they have no effect on time. A photon will redshift but only to maintain constancy of (lateral) time at a fixed radial cosmic time. All photons are continuously linked to their parent temporally. They are never distinct from their parent in cosmic quantized radial time, and maintain constant lateral 3-d curved time. Cosmic radial time does not change continuously for photons or their parent but the photon redshift does to maintain lateral commonality. This `loss’ is is the cosmic correction that must be removed to see the radial quantized redshift. Photons temporally never leave their parent but both spatial dynamical and curvature losses effectively distort the wave function (asymmetry changes will be later demonstrated) until the wave function (with all its photons) can slip into its next quantum state. This will be either the next precise doubling decay fraction or involve a true doubling transformation of its galaxy’s nuclear dipole. Continuous decay processes, which can be represented as entropy in QTC drive quantum transitions, within bounds of uncertainty, which relate time and the continuous fermionic fabric called space which it constructs to accomplish the decay.
One further fascinating result became clear to me while generating this blog. Wave functions occur as wave trains, not just single cycles. Consecutive cycles are connected. This readily explains double galaxies, connected by a redshift difference of precisely a quantum period thus no zero difference is possible (we have exclusion), and they are automatically aligned along their common timeline. These effects provided the basic proofs of quantized redshifts developed in the 1970s, now understandable if you catch them at the right time. Having presented the QTC connection of galaxies with quasars and given my readers some things to contemplate I will pause here before probing further into cosmology.

Book figure Seminar 5 Figure 15
| ← Topic026 | Topic028 → |

Reblogged this on Time in Cosmology.
LikeLike